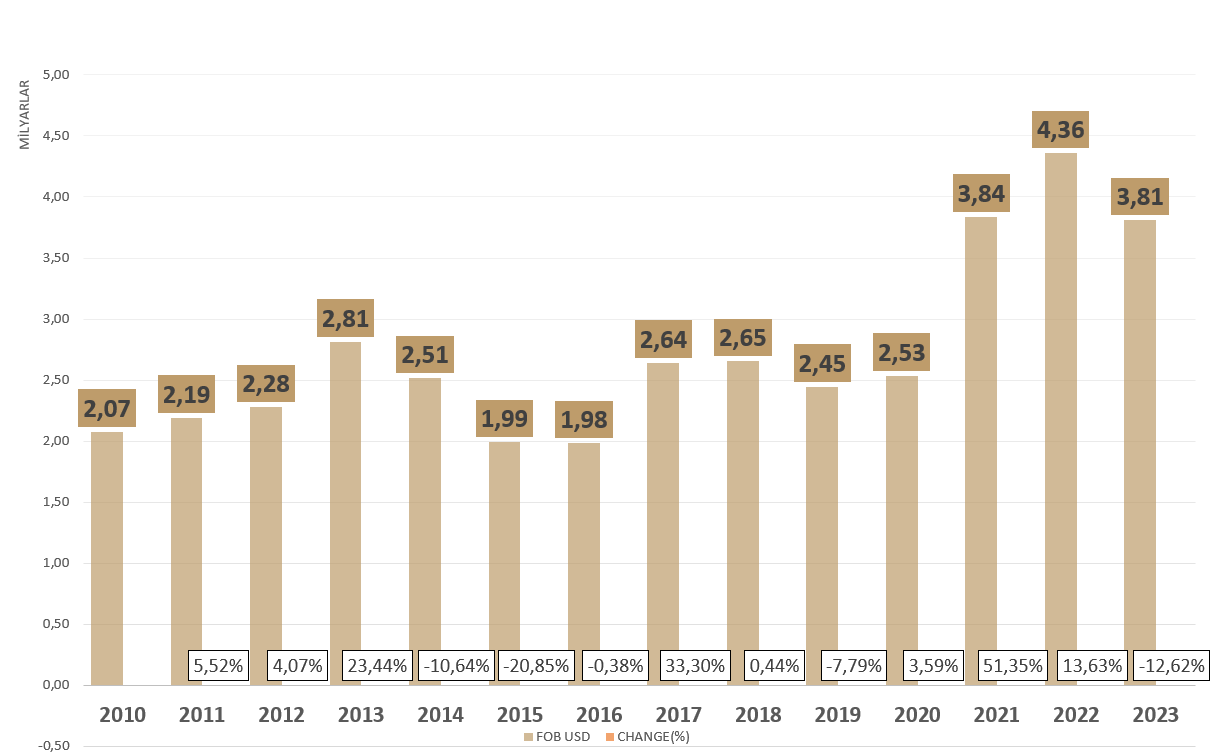
Mineral export statistics of Türkiye between 2010 and 2023
Mineral export statistics of Türkiye between 2000 and 2023
| YEAR |
MINERAL EXPORT VALUE(S) |
CHANGE(%) |
| 2000 |
377.331.381 |
- |
| 2001 |
348.509.170 |
-7,64% |
| 2002 |
377.636.388 |
8,36% |
| 2003 |
412.226.365 |
9,16% |
| 2004 |
575.816.685 |
39,68% |
| 2005 |
711.961.199 |
23,64% |
| 2006 |
1.045.848.800 |
46,90% |
| 2007 |
1.461.038.903 |
39,70% |
| 2008 |
1.836.290.774 |
25,68% |
| 2009 |
1.258.819.179 |
-31,45% |
| 2010 |
2.074.748.902 |
64,82% |
| 2011 |
2.189.194.306 |
5,52% |
| 2012 |
2.278.346.182 |
4,07% |
| 2013 |
2.812.499.036 |
23,44% |
| 2014 |
2.513.334.820 |
-10,64% |
| 2015 |
1.989.371.126 |
-20,85% |
| 2016 |
1.981.798.377 |
-0,38% |
| 2017 |
2.641.753.721 |
33,30% |
| 2018 |
2.653.481.212 |
0,44% |
| 2019 |
2.447.027.355 |
-7,78% |
| 2020 |
2.534.674.135 |
3,59% |
| 2021 |
3.836.353.442 |
51,35% |
| 2022 |
4.359.064.549 |
13,63% |
| 2023 |
3.809.042.661 |
-12,62% |


 PERFORMANCE PER COUNTRIES IN 2000 - 2023